New Publication: Where Are We? The Method of Mapping with GIS in Digital Humanities
I am terrifically honored to have my article, “Where Are We? The Method of Mapping with GIS in Digital Humanities,” in the …
I am terrifically honored to have my article, “Where Are We? The Method of Mapping with GIS in Digital Humanities,” in the …
Futures of American Studies Institute 2016 #fasi16 took place June 20th-26th at Dartmouth College in Hanover, NH. Below are tweets Pt. I or II. See the full schedule here http://www.dartmouth.edu/~futures/schedule/. Tweets from Part II can be found at http://bit.ly/fasi16storifypart2of2.
For about two years, I’ve been collecting data on the use of the #ftm hashtag and, for a shorter time, #mtf hashtag …
As the new semester is upon us–how did that happen so quickly?–I wanted to reflect back on my courses from last semester. …
My slides from my Futures Initiative talk, “Queering the Map: Theoretical Reflections on Spatial Methods,” at the CUNY Graduate Center this Friday …
My essay, “Steps toward Recognition through Openness and the Virtual,” below was written for the Bowdoin Museum College of Art virtual exhibit …
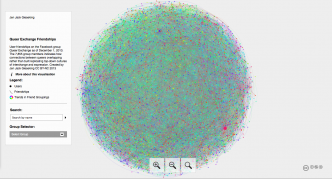
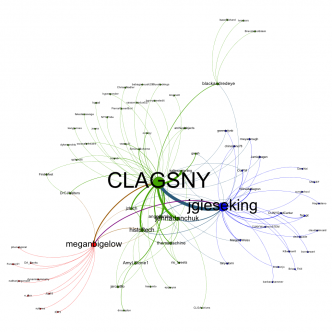
I am increasingly interested in the social networks of queers, broadly and self-defined. One of the largest queer groups on Facebook that …
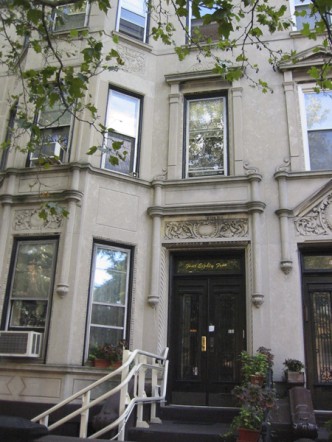
On founding the Lesbian Herstory Archives: Deb Edel: We began talking about how easily our history had gotten lost. Joan Nestle: That …
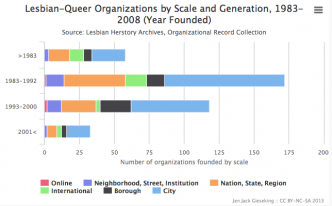
This post is a continuation of a series of posts on my graphic analyses and data visualizations of lesbian-queer space and time …
Historian Marc Stein contends that a sequential narrative of lgbtq history can reflect “the critical study of change over time, with special …
For those of you interested not only in the conversations we shared in the “Queer(ing) New York” Seminar in the City I …
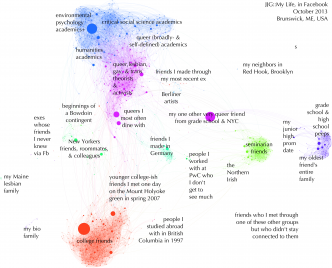
The visualized and labelled history of my life as captured by Fb “friend”-ing and wall posts is exactly what you see below …
The more I create categorical variables, the more the world reads like the preface to Foucault’s The Order of Things. “This book …
Data visualizations are fantastic stuff. Social network analysis, graphic analysis, video, spatial analysis, images, and all other types of #dataviz increasingly capture …
I have arrived at Bowdoin College as the New Media and Data Visualization Specialist, Postdoctoral Fellow in the new Digital and Computational …
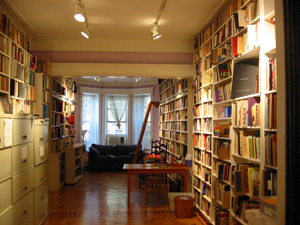
I was sitting in what was a back bedroom of a brownstone in Brooklyn in the winter of 2008-9 and I was …
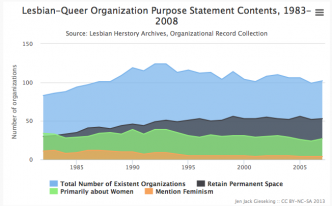
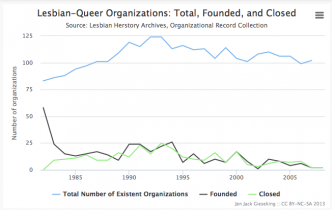
This is the third in a series of posts on data visualizations I have created based on the complete records of all available lesbian-queer …
This is the second in a series of posts on data visualizations I have created based on the complete records of all …
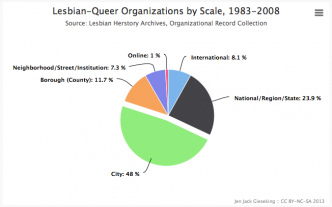
Over the span of a year, I surveyed the complete collection of 2,300+ organizational records at the Lesbian Herstory Archives (LHA). This …